vLLM & Performance Tuning
AI Assistant Case Study: Latency Optimization for granite-3.3-8b-instruct with vLLM
Let’s apply our knowledge to a concrete scenario: you need to serve granite-3.3-8b-instruct that is integrated with a chat application. Your primary goal is to minimize inference latency for a given number of concurrent users - 32 in this case - with an expected generation length <2048 tokens. As you have limited flexibility to scale GPU resources, you want to understand the key vLLM parameters and strategies to maximize performance before simply adding more hardware.
Introduction
Before diving into tuning, it’s important to understand the key performance considerations in vLLM:
Latency: The time it takes for a single request to complete. Of particular importance here is going to be tracking the Time To First Token (TTFT), which will ensure the user can experience snappier responses.
Throughput: The number of requests (or tokens) processed per unit of time. While we’re optimizing for latency, higher throughput often means better resource utilization, which can indirectly help avoid latency spikes due to queuing.
-
First we’ll need to re-deploy the granite-3.3-8b-instruct. Open a terminal and login to your OpenShift cluster. Recreate our project name
vllm.oc project vllm -
We’ll be deploying granite-3.3-8b-instruct through the vllm-kserve helm chart again.
-
Open the
workshop_code/deploy_vllm/vllm_rhoai_custom_2/values.yamlfile to view the new arguments we will pass to the deployment. Your new file looks like the one below to facilitate the optimization exercises:deploymentMode: RawDeployment fullnameOverride: granite-8b model: modelNameOverride: granite-8b uri: oci://quay.io/redhat-ai-services/modelcar-catalog:granite-3.3-8b-instruct args: - "--disable-log-requests" - "--max-num-seqs=32" - "--max-model-len=2048"--disable-log-requests is used to prevent the logging of detailed request information. By default, vLLM logs various details about each incoming request, which can be useful for debugging and monitoring. However, in production environments or when high performance is critical, excessive logging can consume resources and generate large log files. The
--disable-log-requestsflag addresses this by turning off the detailed logging of individual requests.--max-num-seqs configuring the server to handle a maximum of 32 concurrent requests in a single parallel computation step (a batch). For example, if 32 different users send a prompt to your chatbot at the same time.
--max-model-len argument sets the maximum number of tokens that the vLLM server will allow for a single sequence. This total includes both the user’s prompt and the generated response combined.
-
Now that we’ve set the engine arguments we’ll go ahead and deploy the granite model with Helm. Use
helm upgradeif you already have a granite-8b model deployed.helm uninstall granite-8b && \ helm install granite-8b redhat-ai-services/vllm-kserve --version 0.5.11 -f workshop_code/deploy_vllm/vllm_rhoai_custom_2/values.yamlIf you didn’t add the redhat-ai-services helm chart repository to your local helm client, you can do so by running the following command:
helm repo add redhat-ai-services https://redhat-ai-services.github.io/helm-charts/ helm repo update redhat-ai-services -
Login to OpenShift AI and go to your vllm Data Science Project. Wait until the model fully deploys (green check) before continuing.
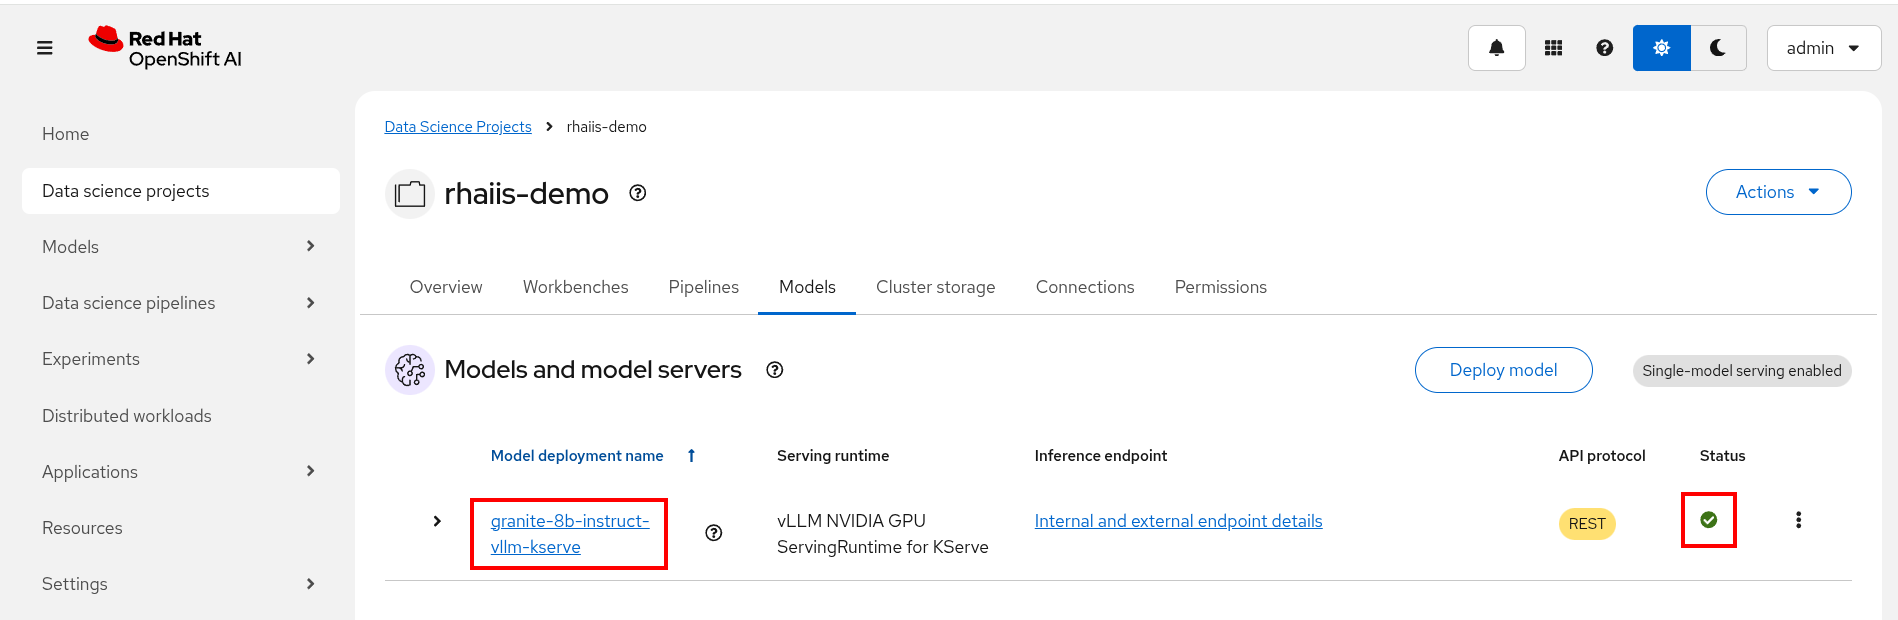
To watch the pod status from the console run the following command:
oc get pods --watch -n vllm | grep -E '(^NAME|granite-8b-predictor)' -
We’ll be running an OpenShift pipeline with GuideLLM to benchmark our model as we step through the optimizations. Clone the following repository.
No need to do this if you cloned the repository in module 2. git clone https://github.com/jhurlocker/guidellm-pipeline.git -
Run the below commands to deploy the pipeline, tasks, and s3 bucket.
No need to do this if you executed these commands in module 2. oc apply -f guidellm-pipeline/pipeline/upload-results-task.yaml -n vllm oc apply -f guidellm-pipeline/pipeline/guidellm-pipeline.yaml -n vllm oc apply -f guidellm-pipeline/pipeline/pvc.yaml -n vllm oc apply -f guidellm-pipeline/pipeline/guidellm-benchmark-task.yaml -n vllm oc apply -f guidellm-pipeline/pipeline/mino-bucket.yaml -n vllm -
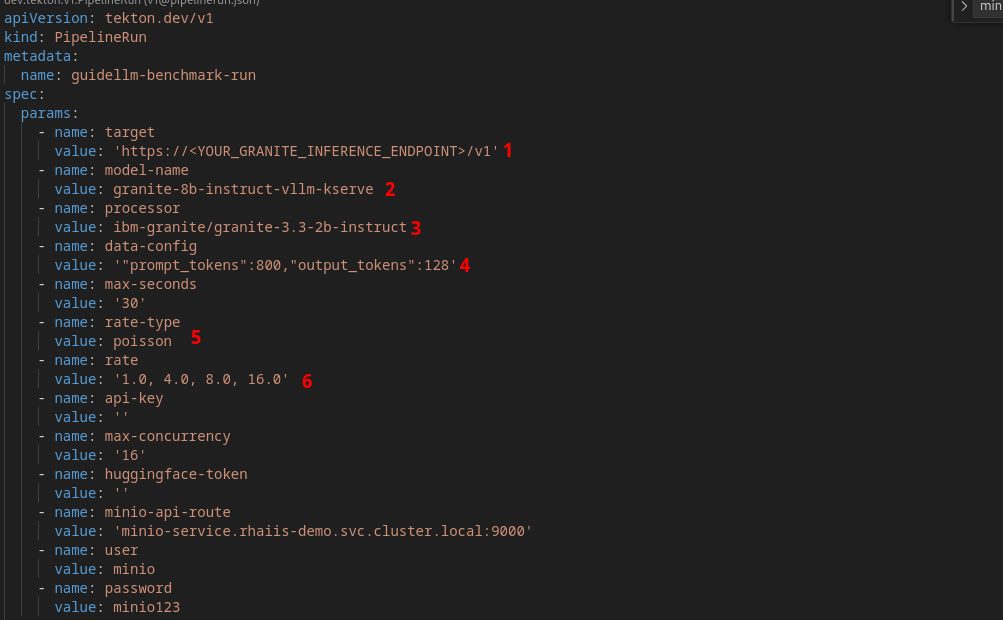
Lets run the GuideLLM pipeline! Open the guidellm-pipeline/pipeline/guidellm-pipelinerun.yaml file. Let’s go through some of the important GuideLLM arguments we’re setting. The pipeline will run a benchmark for 1, 4, 8, and 16 concurrent users.
-
target - Specifies the target path for the backend to run benchmarks against.
-
model-name - Allows selecting a specific model from the server. If not provided, it defaults to the first model available on the server. Useful when multiple models are hosted on the same server.
-
processor - To calculate performance metrics like tokens per second, the benchmark script needs to count how many tokens were generated. To do this accurately, it must use the exact same tokenizer that the model uses. Different models have different tokenizers.
-
data-config - Specifies the dataset to use. This can be a HuggingFace dataset ID, a local path to a dataset, or standard text files such as CSV, JSONL, and more. Additionally, synthetic data configurations can be provided using JSON or key-value strings. Synthetic data options include:
-
prompt_tokens: Average number of tokens for prompts.
-
output_tokens: Average number of tokens for outputs.
-
TYPE_stdev, TYPE_min, TYPE_max: Standard deviation, minimum, and maximum values for the specified type (e.g., prompt_tokens, output_tokens). If not provided, will use the provided tokens value only.
-
samples: Number of samples to generate, defaults to 1000.
-
source: Source text data for generation, defaults to a local copy of Pride and Prejudice.
-
-
rate-type - Defines the type of benchmark to run (default sweep). Supported types include:
-
synchronous: Runs a single stream of requests one at a time. --rate must not be set for this mode.
-
throughput: Runs all requests in parallel to measure the maximum throughput for the server (bounded by GUIDELLM__MAX_CONCURRENCY config argument). --rate must not be set for this mode.
-
concurrent: Runs a fixed number of streams of requests in parallel. --rate must be set to the desired concurrency level/number of streams.
-
constant: Sends requests asynchronously at a constant rate set by --rate.
-
poisson: Sends requests at a rate following a Poisson distribution with the mean set by --rate.
-
sweep: Automatically determines the minimum and maximum rates the server can support by running synchronous and throughput benchmarks, and then runs a series of benchmarks equally spaced between the two rates. The number of benchmarks is set by --rate (default is 10).
-
-
rate - request rate.
-
-
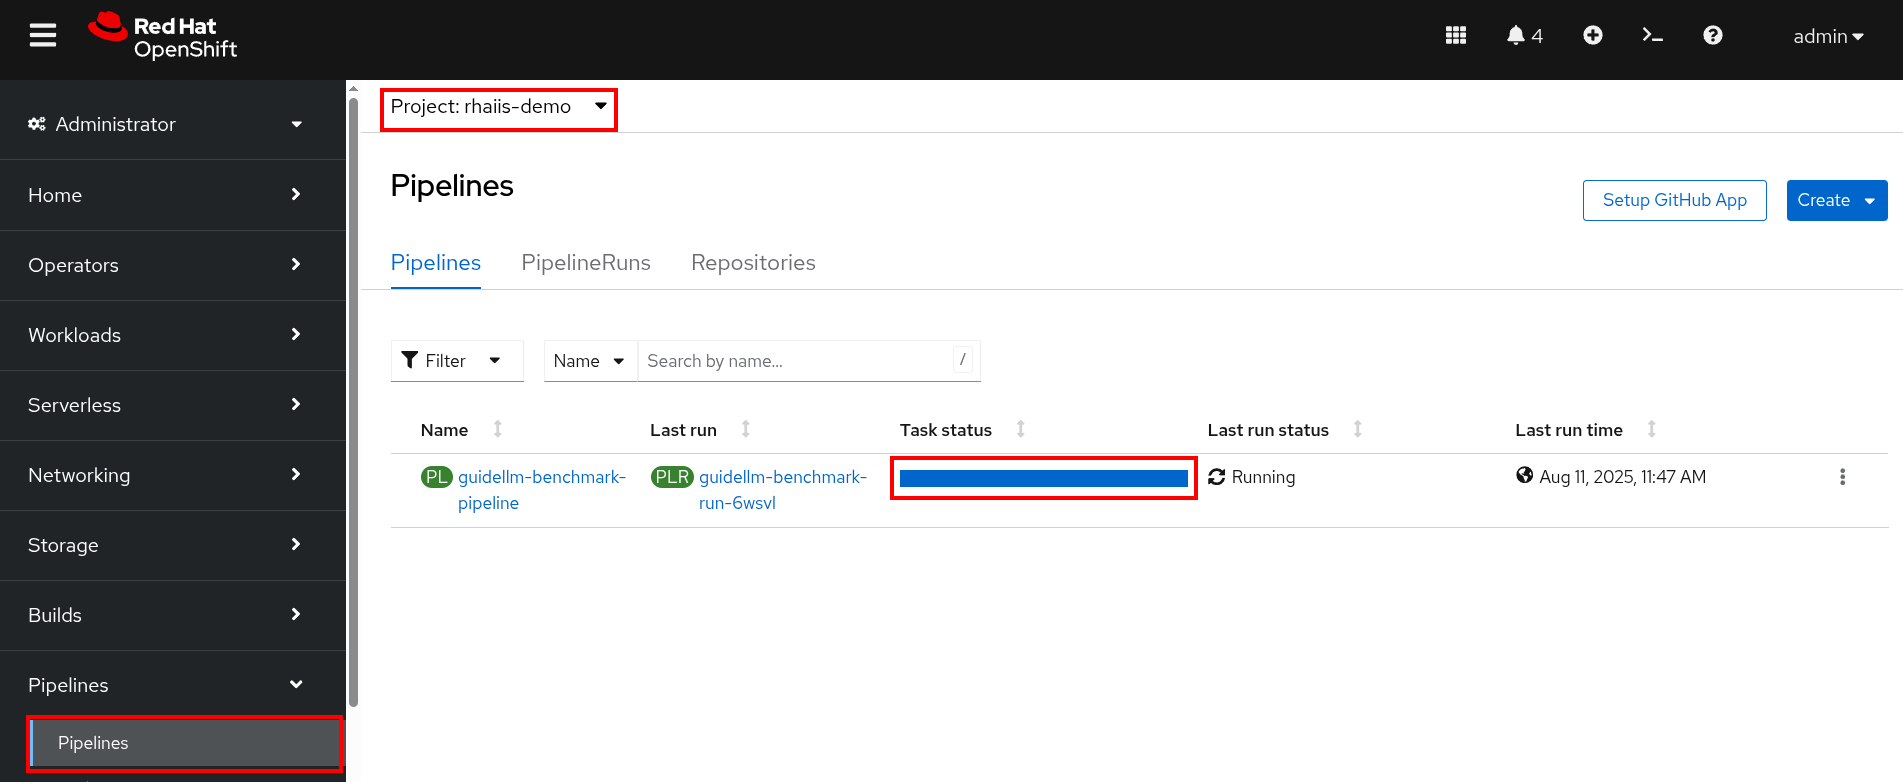
Update the target parameter with your inference endpoint and run the pipeline:
oc create -f guidellm-pipeline/pipeline/guidellm-pipelinerun.yaml -n vllm -
Go to your OpenShift console and view the pipeline run under your vllm project. Click on the bar under Task Status.
Note the two tasks in the pipeline. The first task runs the GuideLLM benchmark and saves the results to a PVC. The second task uploads the results to an s3 bucket. Feel free to click on each task to view the log files.
If the pipeline finishes successfully the tasks will have green check marks like the ones in the image below.
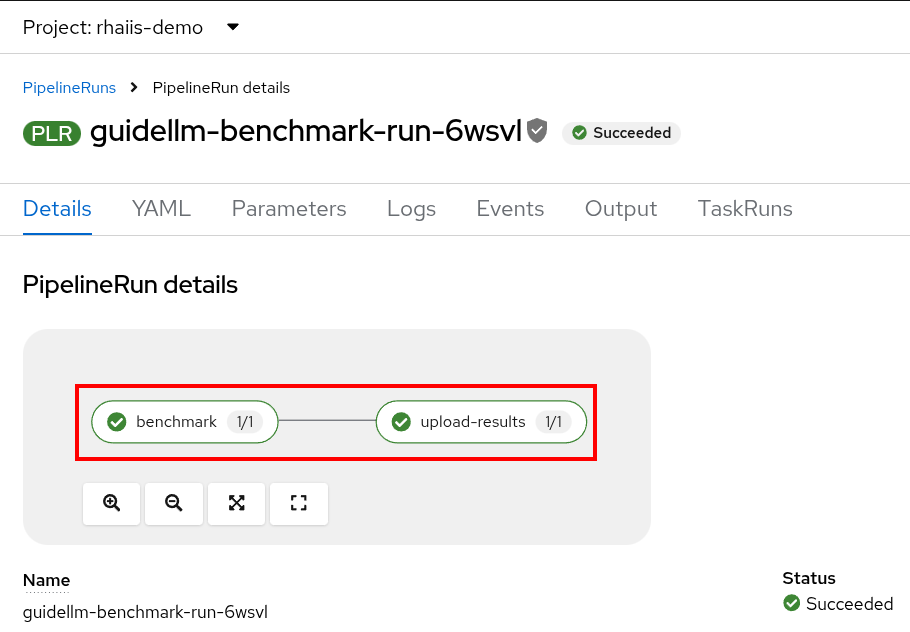
We’ll view the results of the benchmark in the next section, but feel free to access your Minio instance and look at the files in the guidellm-benchmark bucket. -
Go to OpenShift AI and create a workbench with a Standard Data Science notebook. Everything else can be let as the default configuration.
Feel free to use an existing workbench if you already have one running from previous exercises. -
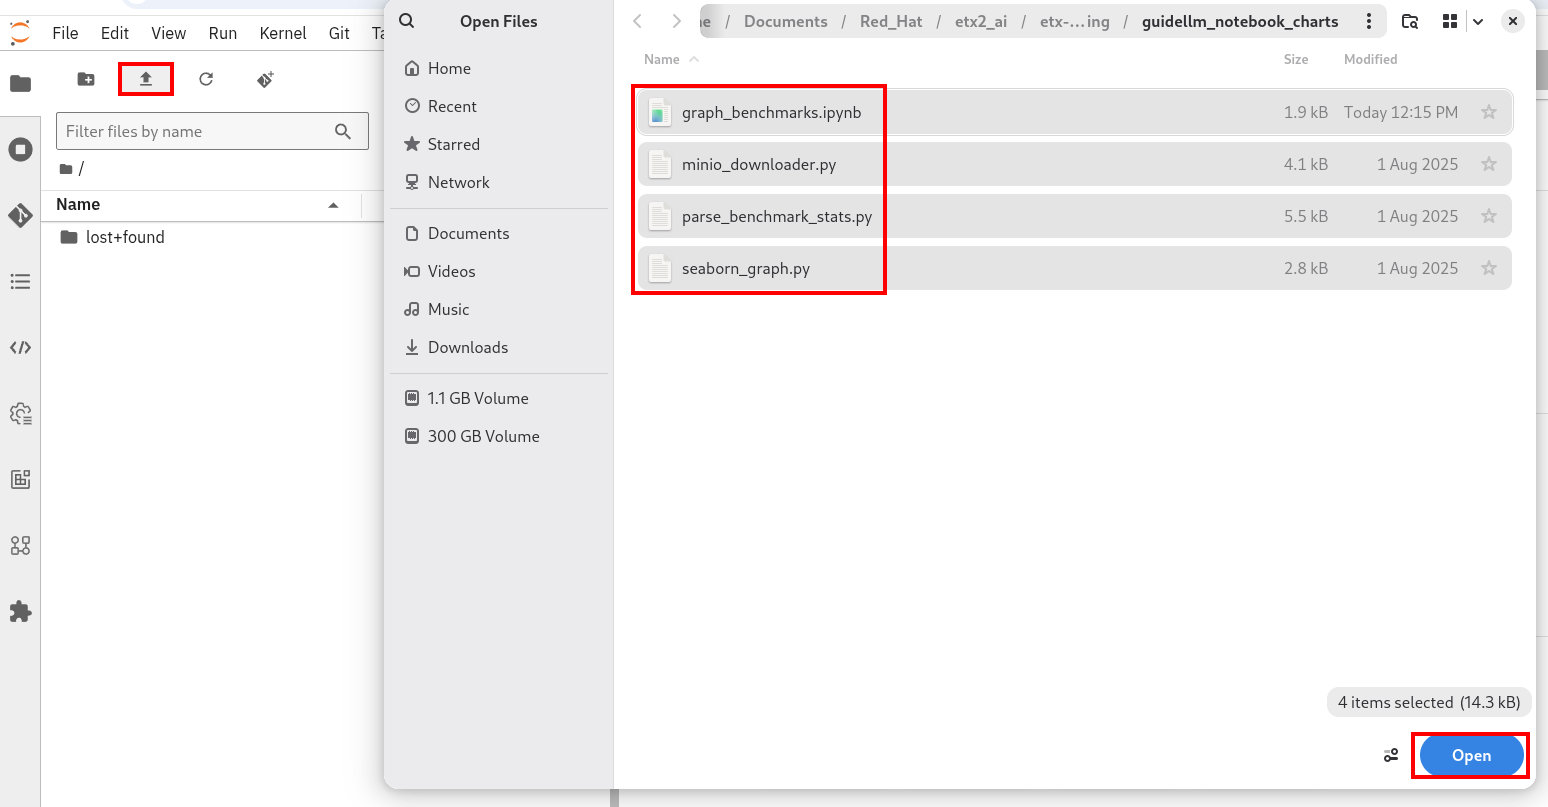
Open your workbench once it starts up and upload all of the files under guidellm_notebook_charts.
-
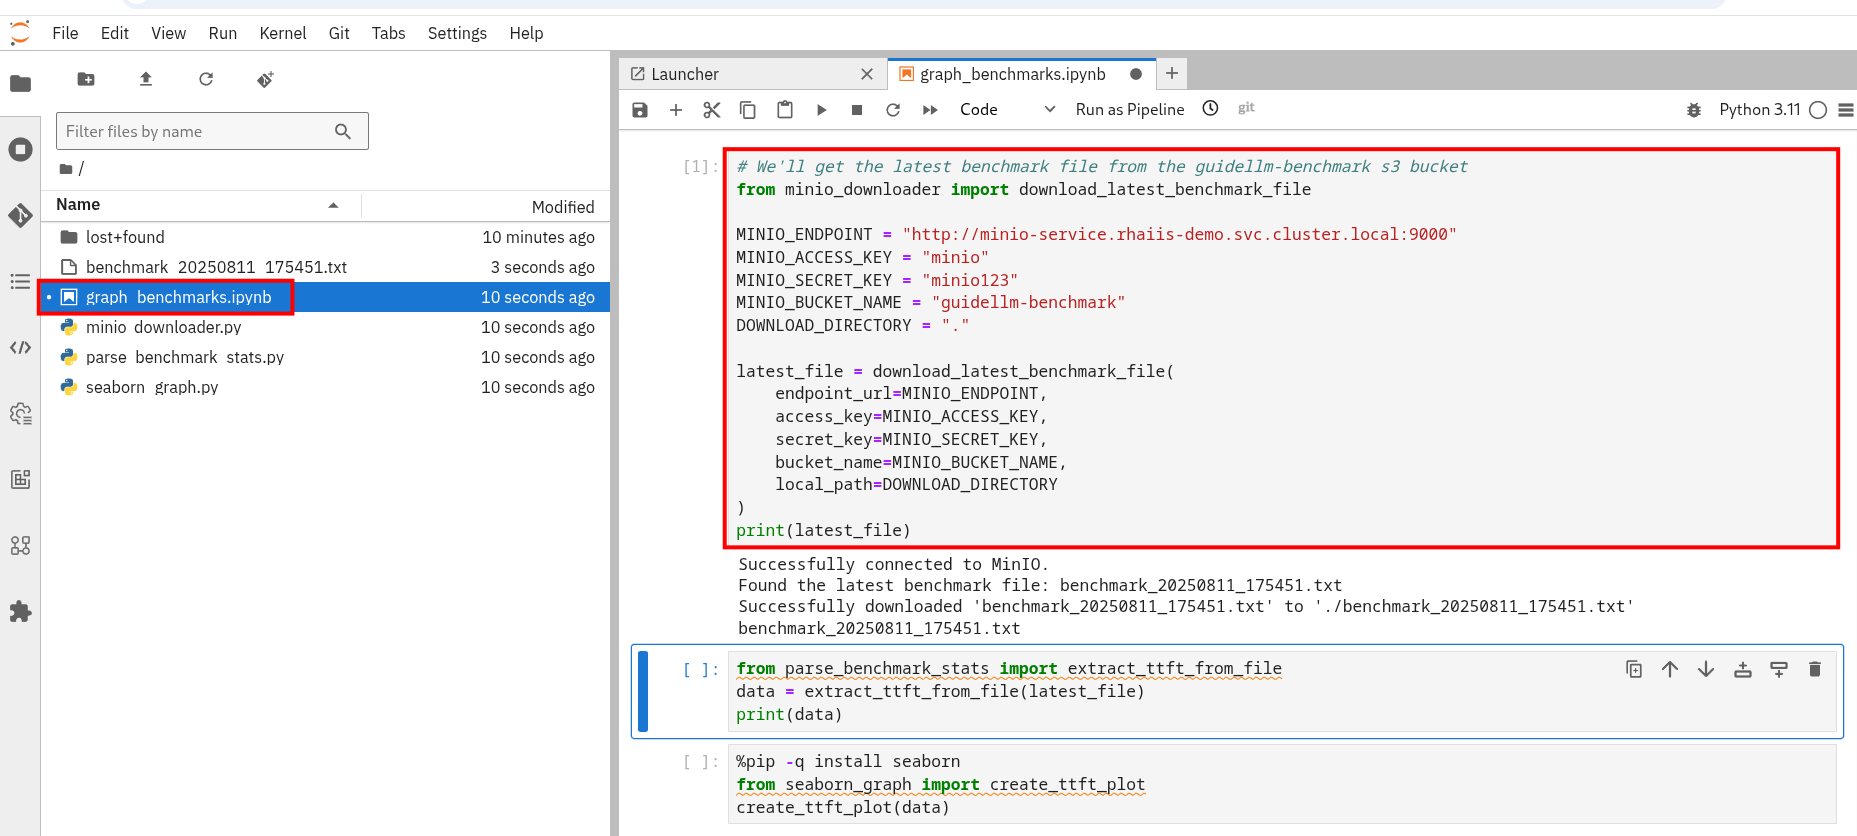
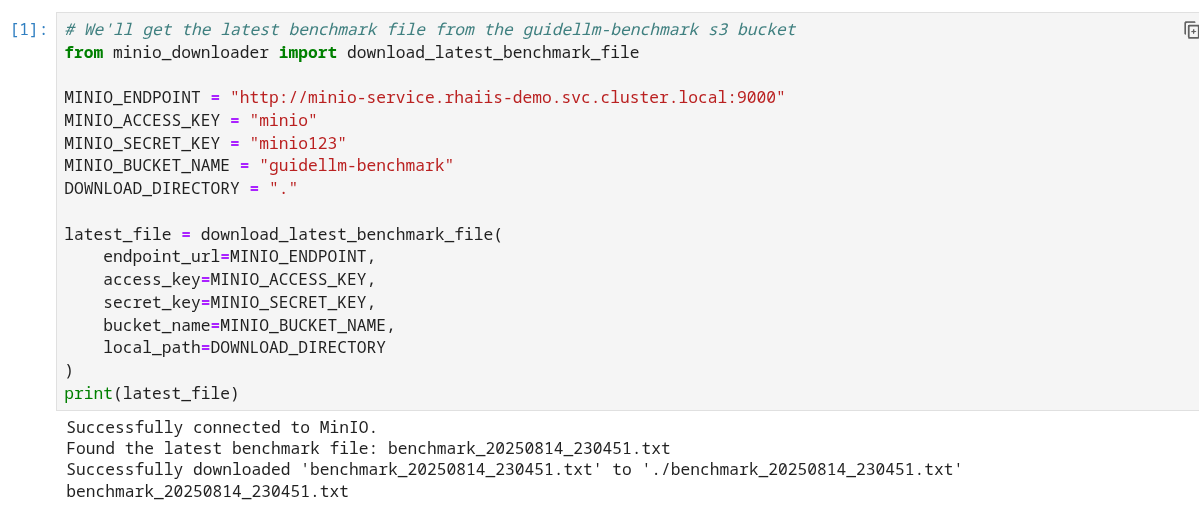
Open the graph_benchmarks.ipynb notebook and run the first cell. This will download the benchmark file from s3 that was created and uploaded when we ran the pipeline.
-
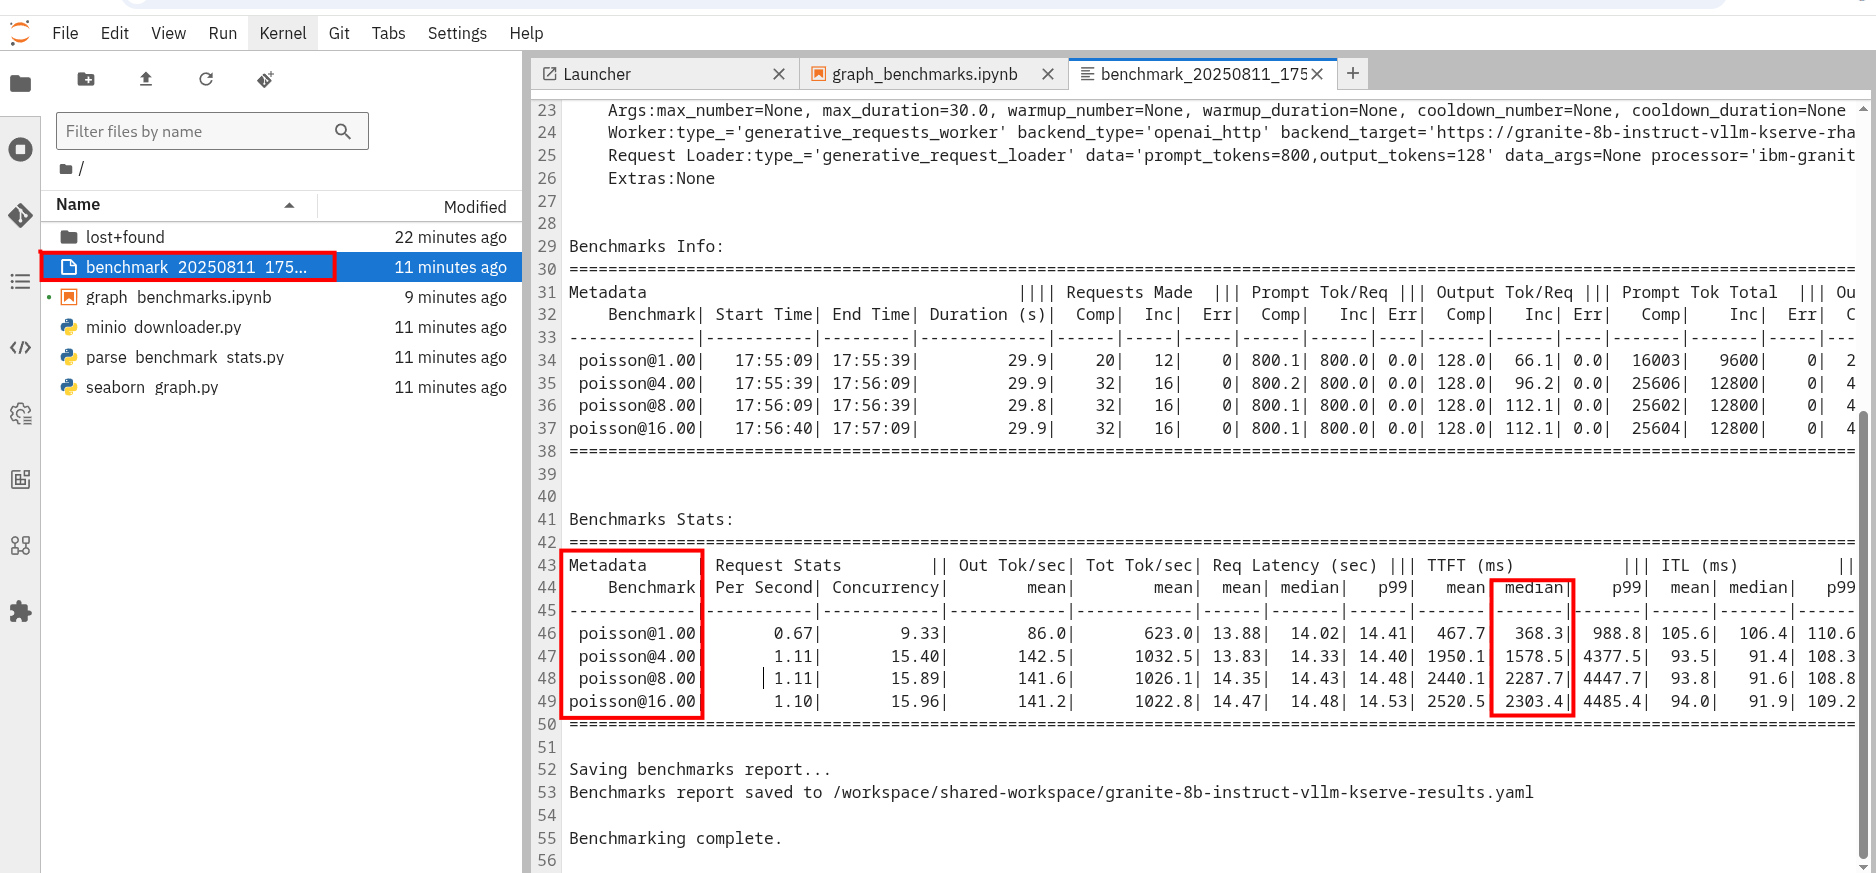
You should now see a benchmark_<TIMESTAMP>.txt file. This should be the latest time stamped benchmark in the s3 bucket. Open that file and in the top toolbar go to View → Wrap Words so you the file is easier to read.
Review the results and notice the two columns highlighted in red. You can see the number of sequences under metadata benchmark and the related median TTFT.
-
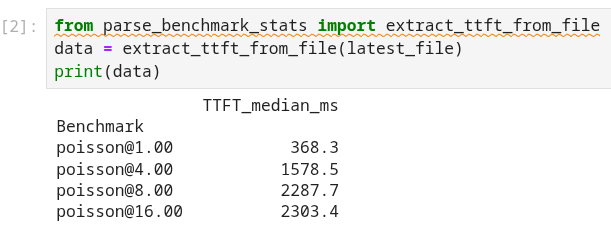
Run the next cell to extract the Metadata benchmark and the median TTFTs.
-
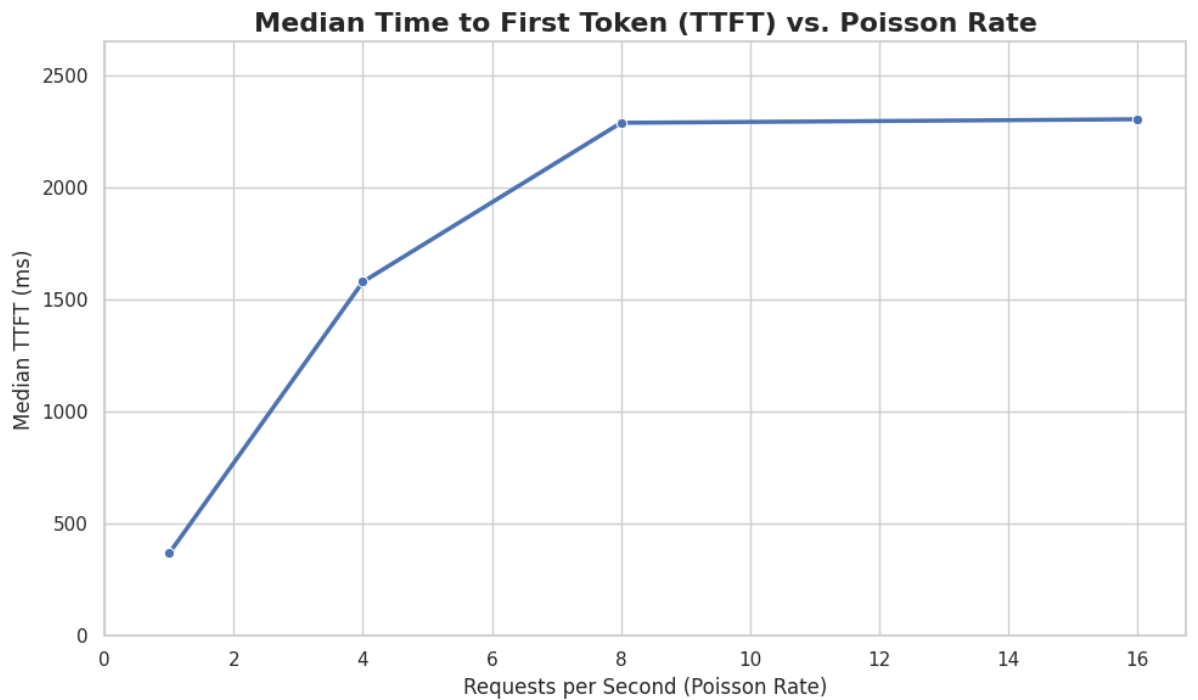
Finally, run the last cell in the notebook to graph the median TTFT per number of sequences. All reported times are in milliseconds. Notice how quickly we exceed the "seconds" threshold with even a slight increase in concurrent users—serving LLMs is hard!
-
Rename the benchmark file as
benchmark_1.txt. We’ll use this file in a later exercise.
vLLM Tuning Strategies for Granite 3.3 8B Latency
Granite-3.3-8b-instruct is a popular, powerful small-size dense model. Here are the primary avenues for optimization.
GPU Allocation & Batching Parameters: Managing Concurrency
For a "given amount of concurrent users," how you manage batching is critical to maximize GPU utilization without introducing excessive queueing latency. Let’s take a look at some of the most popular vllm configurations.
--max-model-len: The maximum sequence length (prompt + generated tokens) the model can handle.
Goal: Set this to the minimum reasonable length for your use case. Too small means requests get truncated; too large means less space for KVCache, which will impact your performance.
At startup, vllm will profile the model using this value, as it needs to ensure it is able to serve at least one request with length=max-model-len.
This is also a trade-off with the next parameter, max-num-seqs.
Tuning: If most of your requests are short, keeping max-model-len tighter can allow more requests into the batch (by increasing max-num-seqs).
max-num-batched-tokens is a highly related parameter. It’s limiting the amount of tokens the scheduler can schedule, rather than what the model can produce.
So the actual number limiting the amount of memory allocated for the model runtime is actually min(max-model-len, max-num-batched-tokens).
|
You can verify the impact of this parameter by increasing its value when starting vLLM and then observing the amount of memory reserved for KVCache. Check out the logs for our starting config:
Our starting config listed here for reference only. No need to apply it again
deploymentMode: RawDeployment

fullnameOverride: granite-8b
model:
  modelNameOverride: granite-8b
  uri: oci://quay.io/redhat-ai-services/modelcar-catalog:granite-3.3-8b-instruct
  args:
    - "--disable-log-requests"
    - "--max-num-seqs=32"
- "--max-model-len=2048"-
Go to your OpenShift web console. Select the vllm project and open the logs for the granite-8b-predictor-00003-deploymentXXXXX pod.
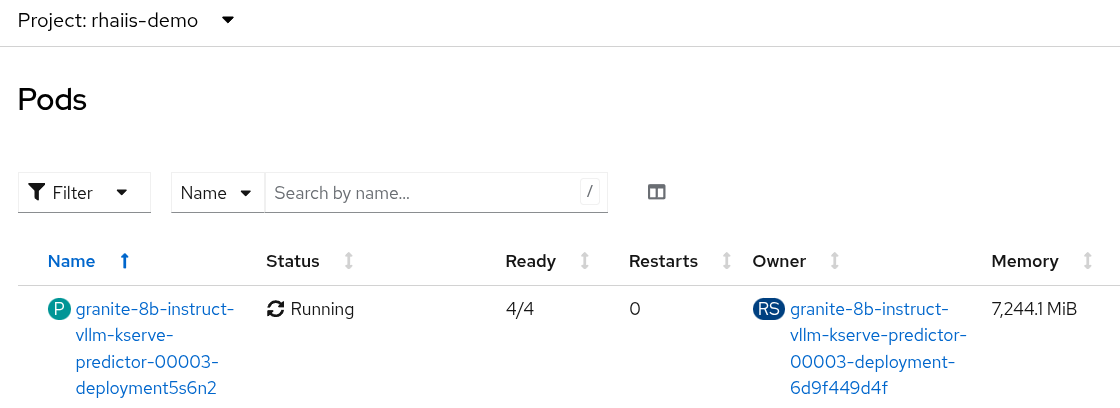
Note the Available KV cache size at the top of the log
INFO 08-26 19:08:24 [gpu_worker.py:227] Available KV cache memory: 4.19 GiB INFO 08-26 19:08:24 [kv_cache_utils.py:715] GPU KV cache size: 27,488 tokens
-
Now increase the model size to
--max-model-len 4096 --max-num-batched-tokens 4096:Open workshop_code/deploy_vllm/vllm_rhoai_custom_2/values.yaml and set the below configuration:
deploymentMode: RawDeployment fullnameOverride: granite-8b model: modelNameOverride: granite-8b uri: oci://quay.io/redhat-ai-services/modelcar-catalog:granite-3.3-8b-instruct args: - "--disable-log-requests" - "--max-num-seqs=32" - "--max-model-len=4096" - "--max-num-batched-tokens=4096" -
Rerun the helm deployment
helm uninstall granite-8b && \ helm install granite-8b redhat-ai-services/vllm-kserve --version 0.5.11 -f workshop_code/deploy_vllm/vllm_rhoai_custom_2/values.yaml -
After the model is redeployed take a look at the Available KV Cache size in the pod’s log file. Note that the Available KV Cache size is now smaller than it was before.
INFO 08-26 20:01:28 [gpu_worker.py:227] Available KV cache memory: 3.99 GiB INFO 08-26 20:01:28 [kv_cache_utils.py:715] GPU KV cache size: 26,112 tokens
--max-num-seqs: The maximum number of sequences (requests) that can be processed concurrently. This is often referred to as the batch size, allowing for higher throughput.
Goal: Set this to the minimum reasonable length for your use case. When this is too high, your requests under load might get fractioned into smaller chunks resulting in higher end-to-end latency. If this is too low, you might be under-utilizing your GPU resources.
Let’s see this case in practice. Modify the script to limit the number max requests to 1 and run the benchmark pipeline with 4 requests at a time.
-
Update the workshop_code/deploy_vllm/vllm_rhoai_custom_2/values.yaml with the
max-num-seqsto 1.deploymentMode: RawDeployment fullnameOverride: granite-8b model: modelNameOverride: granite-8b uri: oci://quay.io/redhat-ai-services/modelcar-catalog:granite-3.3-8b-instruct args: - "--disable-log-requests" - "--max-num-seqs=1" - "--max-model-len=2048" -
Rerun the helm deployment
helm uninstall granite-8b && \ helm install granite-8b redhat-ai-services/vllm-kserve --version 0.5.11 -f workshop_code/deploy_vllm/vllm_rhoai_custom_2/values.yaml -
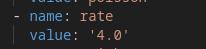
After the model redeploys update the /guidellm-pipeline/pipeline/guidellm-pipelinerun.yaml rate to 4.0.
-
Rerun the guidellm benchmark pipeline.
oc create -f guidellm-pipeline/pipeline/guidellm-pipelinerun.yaml -n vllm -
After the pipeline finishes go to your OpenShift AI workbench and open the graph_benchmarks.ipynb file. Execute the first cell to download the latest benchmark file.
-
Open the benchmark_1.txt file and the latest benchmark file (benchmark_<TIMESTAMP>.txt) you just downloaded from Minio. Go to View → Wrap Words so it’s easier to read the files.
What is happening here is that the engine is effectively being throttled and is only executing one request at a time. This is over 6x slower!
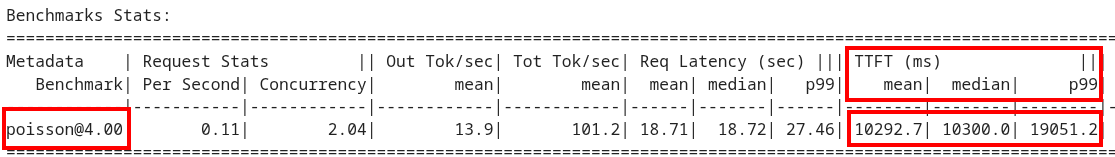 Figure 1. Latest benchmark file
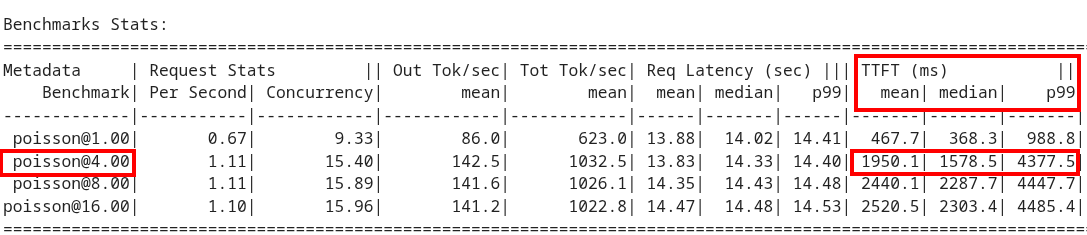 Figure 2. First benchmark file
Also notice another important indicator of an unhealthy deployment from the logs. Note the 31 pending requests:
INFO 08-14 23:05:18 metrics.py:455] Avg prompt throughput: 152.5 tokens/s, Avg generation throughput: 14.3 tokens/s, Running: 1 reqs, Swapped: 0 reqs, Pending: 31 reqs, GPU KV cache usage: 2.9%, CPU KV cache usage: 0.0%.
Especially when coupled with high waiting time (
vllm:request_queue_time_seconds_summetric from/metrics).You can access the metrics by going to your https://<INFERENCE_ENDPOINT>/metrics in a browser.
vllm:request_queue_time_seconds_sum{model_name= "granite-8b"} 35.21637320518494
Model Quantization
Quantization is arguably the most impactful change you can make for latency, especially with vLLM’s efficient kernel implementation for w8a16 or w4a16.
Why? Reducing precision directly shrinks the model’s memory footprint and enables faster arithmetic on modern GPUs.
What to try (highly dependent on available hardware):
FP8: If you have access to NVIDIA H100 GPUs or newer (e.g., B200), FP8 (E4M3 or E5M2) is a game-changer. These GPUs have dedicated FP8 Tensor Cores that offer significantly higher throughput compared to FP16. This provides a direct path to lower latency per token without significant accuracy loss for Llama 3 models.
INT8 (e.g., AWQ): Starting with A100 or even A6000/3090 GPUs, INT8 quantization is an excellent choice. It reduces the model to 8B * 1 byte = 8GB, halving the memory footprint and enabling faster integer operations.
INT4: If you’re pushing for absolute minimum latency and can tolerate a small accuracy trade-off, INT4 (e.g., via AWQ or other 4-bit methods) can reduce the model to 8B * 0.5 bytes = 4 GB. This is extremely memory-efficient and, on some hardware, can offer further speedups. Test accuracy thoroughly with your specific use case, as 4-bit can sometimes be more sensitive. Similarly, check out FP4 versions when Nvidia Blackwell hardware is available.
| Quantization Type | Recommended Hardware | Key Benefits for Latency | Memory Footprint (for Llama 3 8B) | Accuracy Consideration | Notes |
|---|---|---|---|---|---|
FP8 (E4M3/E5M2) |
NVIDIA H100 (or newer) |
- Dedicated FP8 Tensor Cores for significantly higher throughput. |
8B * 1 byte ~= 8 GB |
Minimal accuracy loss for Llama 3 models. |
Already a standard for high-performance inference. |
INT8 (e.g., AWQ) |
NVIDIA A100, A6000 (or newer) |
- Halves memory footprint. |
8B * 1 byte ~= 8 GB |
Generally decent accuracy preservation. |
Widely supported (across manufacturers) and fast. |
INT4 (e.g., AWQ) |
NVIDIA A100, A6000 (or newer) |
- Extremely memory-efficient. |
8B * 0.5 bytes ~= 4 GB |
Requires an accuracy trade-off. |
Pushes for absolute minimum latency. |
FP4 |
NVIDIA Blackwell (B200) |
- New architecture support for even lower-precision floating-point. |
8B * 0.5 bytes ~= 4 GB |
Designed to maintain better accuracy than integer 4-bit, but still requires validation. |
Emerging standard with the latest hardware (e.g., NVIDIA Blackwell). Look for NVFP4 variants. |
Please refer to the compatiblity chart https://docs.vllm.ai/en/latest/features/quantization/supported_hardware.html for up to date quantization support in vLLM.
-
Let us try to run a w8a8 int8 model with the original vLLM engine arguments we started with. Update the workshop_code/deploy_vllm/vllm_rhoai_custom_2/values.yaml with the following values. Make sure you update the uri with the correct model.
deploymentMode: RawDeployment fullnameOverride: granite-8b model: modelNameOverride: granite-8b uri: oci://quay.io/redhat-ai-services/modelcar-catalog:granite-3.1-8b-instruct-quantized.w8a8 args: - "--disable-log-requests" - "--max-num-seqs=32" - "--max-model-len=2048" -
Rerun the helm deployment
helm uninstall granite-8b && \ helm install granite-8b redhat-ai-services/vllm-kserve --version 0.5.11 -f workshop_code/deploy_vllm/vllm_rhoai_custom_2/values.yaml -
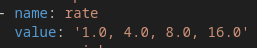
After the model redeploys update the /guidellm-pipeline/pipeline/guidellm-pipelinerun.yaml rate to 1.0, 4.0, 8.0, 16.0.
-
Rerun the guidellm benchmark pipeline.
oc create -f guidellm-pipeline/pipeline/guidellm-pipelinerun.yaml -n vllm -
After the pipeline finishes go to your OpenShift AI workbench and open the graph_benchmarks.ipynb file. Execute the first cell to download the latest benchmark file.
-
Copy and paste the code snippet below into the second cell or edit your code to be the same. This code extracts the median TTFT from our first benchmark run with the full weight Granite model and extracts the median TTFT from the most recent benchmark with the quantized version.
Execute the cell.
#extract the Metadata benchmark and the median TTFTs from parse_benchmark_stats import extract_ttft_from_file data = extract_ttft_from_file('benchmark_1.txt') data2 = extract_ttft_from_file(latest_file) print(data) print(data2) -
Copy and paste the code snippet below into the third cell or edit your code to be the same. This will generate a graph of the median TTFT for the poission rate for both models.
Execute the cell.
#graph of median TTFT vs poisson rate %pip -q install seaborn from seaborn_graph import create_ttft_plot create_ttft_plot(data, data2, 'granite-3.3-8b-instruct', 'granite-3.1-8b-instruct-quantized.w8a8')
Your chart should look similar to the one below.
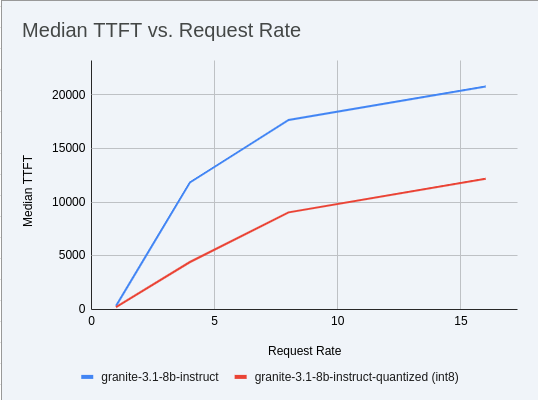
Up to 2x speedup!
Using a smaller model
Following the same principle as quantization, serving a smaller model (when accuracy on task is acceptable) will enable faster response
times as less data is moved around (model weights+activations) and less sequential computations are involved (generally fewer layers).
For this particular use-case, consider ibm-granite/granite-3.1-2b-instruct.
Using a different model
While Granite 3 is a strong dense model, for certain latency-sensitive scenarios, considering a Mixture-of-Experts (MoE) model like Mixtral 8x7B could be a compelling alternative.
Why MoE for Latency? MoE models have a large total number of parameters (e.g., Mixtral 8x7B has 47B total parameters), but critically, they only activate a sparse subset of these parameters (e.g., 13B for Mixtral 8x7B) for each token generated. This means the actual computational cost per token is significantly lower than a dense model of its total parameter count. Which is especially true when sharding experts over multiple GPUs with MoE especially with vLLM’s optimized handling of MoE sparsity.
Trade-offs: While MoE models can offer lower inference latency per token due to their sparse activation, they still require enough GPU memory to load the entire model’s parameters, not just the active ones. So, Mixtral 8x7B will demand more VRAM than Llama 3 8B, even if it’s faster per token. You’ll need sufficient GPU memory (e.g., a single A100 80GB or multiple smaller GPUs with tensor parallelism) to fit the full 47B parameters.
vLLM has strong support for MoE models like Mixtral, including optimizations for their unique sparse compute patterns and dynamic routing.
Consider When: Your application might benefit from the increased quality often associated with larger (total parameter) MoE models, combined with the per-token speed advantages of their sparse computation.
Speculative Decoding
Speculative decoding is a powerful technique to reduce the generation latency, particularly noticeable for the Time To First Token (TTFT). Speculative decoding is fundamentally a tradeoff: spend a little bit of extra compute to reduce memory movement. The extra compute is allocated towards the smaller draft model and consequent proposer verifying step. At low request rates, we are memory-bound, so reducing memory movement can really help with latency. However, at higher throughputs or batch sizes, we are compute-bound, and speculative decoding can provide worse performance.
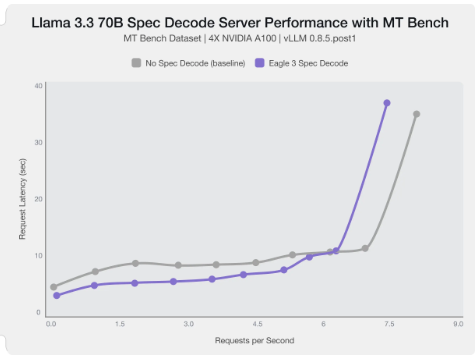
The graph here from this blog highlights the tradeoffs of speculative decoding at low request rate vs bigger batch sizes.
Take away message: As long as the number of requests is bound to use a non-intensive amount of GPU resources (lower req/s), speculative decoding can provide a nice speedup.
| Speculative decoding in vLLM is not yet fully optimized and does not always yield intended inter-token latency reductions. In particular in this case it will fallback to V0 due to V1 still not supporting this particular speculation technique. Mind that what we’re comparing here is not going to be exactly apples to apples, as the V0 and V1 engine have quite substantial architectural differences. |
What to try: You’ll need to specify a smaller draft model. A good starting point for Llama/Granite might be a smaller Llama/Granite variant or as in this example a speculator trained specifically for our use-case. Let’s redeploy with the following engine arguments:
-
Update the workshop_code/deploy_vllm/vllm_rhoai_custom_2/values.yaml with the following values.
deploymentMode: RawDeployment fullnameOverride: granite-8b model: modelNameOverride: granite-8b uri: oci://quay.io/redhat-ai-services/modelcar-catalog:llama-3.1-8b-instruct-eagle3 env: - name: HF_HUB_OFFLINE value: "1" args: - --disable-log-requests - --max-num-seqs=32 - --max-model-len=2048 - --max-num-batched-tokens=2048 - '--speculative-config={"model": "/mnt/models/llama-3.1-8b-instruct-eagle3", "method": "eagle3", "num_speculative_tokens": 4, "draft_tensor_parallel_size": 1}'
-
Rerun the helm deployment
helm uninstall granite-8b && \ helm install granite-8b redhat-ai-services/vllm-kserve --version 0.5.11 -f workshop_code/deploy_vllm/vllm_rhoai_custom_2/values.yamlvLLM will spin up an instance with the two models. There’s no free-lunch though, mind that the GPU memory will now be comprised of: the original
llama-3.1-8b-instructweights +llama-3.1-8b-instruct-eagle3proposer weights + a KV cache for both models.Shown below is an example mean TTFT vs request rate for speculative decoding with
ibm-granite/granite-3.1-8b-instruct weightsandibm-granite/granite-3.0-8b-instruct-accelerator.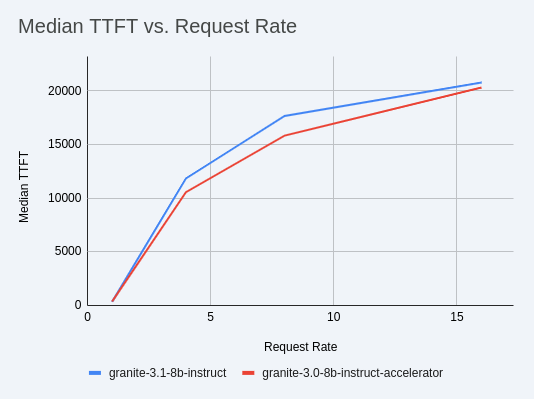
-
Send in a request to the inference endpoint.
curl -X POST -H "Content-Type: application/json" -d '{
    "prompt": "What does Red Hat do?",
    "max_tokens": 100,
    "model": "granite-8b"
}' https://<YOUR-EXTERNAL-INFERENCE-ENDPOINT>/v1/completions | jq
A key metric to keep an eye on when serving a speculator is the
acceptance rate:
This is the percentage of tokens being produced by the speculator that match the ones of the draft model. Here we’re still on the lower side as ideally you would want to see this number be higher.
This is tied to major drawback holding back the adoptability of speculative decoding, which is the fact that the speculator needs to be trained specifically for the model you intend to deploy, in order to achieve an high acceptance rate.
Bonus: Batch Processing Case Study: Throughput Optimization for granite-3.1-8b-instruct with vLLM
What arguments would you change for a batch processing job that analyzes 100,000 customer reviews every night?
Final Notes
Optimization is an iterative process. As you tune vLLM, continuously monitor key metrics:
-
Time To First Token (TTFT): Critical for interactive applications.
-
Throughput (Tokens/sec or Requests/sec): To ensure your concurrency goals are met.
-
GPU Utilization: High utilization indicates efficient use of resources.
-
GPU KV cache usage: At very high rates early on into a benchmark, it is an indicator of likely insufficient memory for KV cache.
-
Important engine arguments for customers that don’t want to send data to the vLLM team
-
https://docs.vllm.ai/en/stable/usage/usage_stats.html
-
VLLM_NO_USAGE_STATS=1
-
DO_NOT_TRACK=1
-
-