Evaluating System Performance with GuideLLM
In Generative AI systems, evaluating system performance including latency, throughput and resource utilization is just as important as evaluating model accuracy or quality. Here’s why:
-
User Experience: High latency leads to sluggish interactions, which is unacceptable in chatbots, copilots and real-time applications. Users expect sub-second responses.
-
Scalability: Throughput determines how many requests a system can handle in parallel. For enterprise GenAI apps, high throughput is essential to serve multiple users or integrate with high-frequency backend processes.
-
Cost Efficiency: Slow or inefficient systems require more compute to serve the same volume of requests. Optimizing performance directly reduces cloud GPU costs and improves ROI.
-
Fair Benchmarking: A model may appear “better” in isolated evaluation, but if it requires excessive inference time or hardware, it may not be viable in production. True model evaluation must balance quality and performance.
-
Deployment Readiness: Latency and throughput impact architectural decisions (e.g., batching, caching, distributed serving). Measuring them ensures a model is viable under real-world constraints.
What is GuideLLM?
GuideLLM is a toolkit for evaluating and optimizing the deployment of LLMs. By simulating real-world inference workloads, GuideLLM enables you to easily assess the performance, resource requirements and cost implications of deploying LLMs on various hardware configurations. This approach ensures efficient, scalable and cost-effective LLM inference serving while maintaining high service quality.
GuideLLM is now officially a part of the vLLM upstream project. This toolset is one of the primary ways Red Hat internal teams are benchmarking customer models. GuideLLM will be the main framework we will recommend to our customers with the scope of model performance and optimization.
Trusty AI vs GuideLLM
Trusty AI maintains the scope of responsible AI, while GuideLLM is focused on benchmarking and model optimization. That being said, there are some current crossovers. Trusty AI incorporates lm-eval-harness and GuideLLM is roadmapped to include this test harness as well. Trusty AI will continue to be an incorporated and supported operator deployment in RHOAI. There are currently no plans to have a similar deployment method for GuideLLM.
Set Up GuideLLM tekton pipeline
There are several current ways you may deploy and use GuideLLM.
-
CLI tool: documented in the upstream project.
-
Python library: Not yet in current upstream documentation. You can see an example here in this guide
-
Kubernetes job: You can see an example of this in this repository
-
Tekton pipeline: Refer to this repository which was forked from above repository.
-
Run the below command to install the Tekton CLI
curl -sL $(curl -s https://api.github.com/repos/tektoncd/cli/releases/latest | grep "browser_download_url.*_Linux_x86_64.tar.gz" | cut -d '"' -f 4) | sudo tar -xz -C /usr/local/bin tkn
tkn version
-
For Mac users (Darwin), update the above curl command to download the *_Darwin_all.tar.gz archive.
|
For our lab today, we will utilize the Tekton pipeline on our OpenShift AI cluster. A pipeline deployment provides the following benefits:
-
Automation and reproducibility
-
Cloud-native / kubernetes-native
-
Scalability and resource optimization: benchmarking can be resource intensive, particularly when simulating high loads or testing large models. The dynamic provisioning/de-provisioning of necessary resources with Tekton can handle this well, which is particularly critical for the expensive compute
-
Modular
-
Integration with existing MLOps workflows
-
Version control / auditability
-
Better handling of complex, multi-stage workflows
First, we’ll clone the ETX vLLM optimization repo. Then we’ll clone the benchmark pipeline repo, apply the PVC, task and pipeline. We’ll also create an s3 bucket in Minio where the pipeline will upload the benchmark results.
-
Clone the ETX vLLM optimization repo.
git clone https://github.com/redhat-ai-services/etx-llm-optimization-and-inference-leveraging.git -
Clone the GuideLLM pipeline repo.
cd etx-llm-optimization-and-inference-leveraging git clone https://github.com/jhurlocker/guidellm-pipeline.git -
Apply the PVC, task, and pipeline
oc apply -f guidellm-pipeline/pipeline/upload-results-task.yaml -n vllm
oc apply -f guidellm-pipeline/pipeline/guidellm-pipeline.yaml -n vllm
oc apply -f guidellm-pipeline/pipeline/pvc.yaml -n vllm
oc apply -f guidellm-pipeline/pipeline/guidellm-benchmark-task.yaml -n vllm
oc apply -f guidellm-pipeline/pipeline/mino-bucket.yaml -n vllm
Before running the pipeline, let’s review the options for GuideLLM more closely.
GuideLLM Arguments
-
Peruse the available GuideLLM configuration options.
-
The GitHub README gives detailed information about configuration flags
Input/Output tokens
For different use cases, you can set different standardized dataset profiles that can be passed in as arguments in GuideLLM. For example, the following variables represent input and output tokens, respectively, based on the given use case:
-
Chat (512/256)
-
RAG (4096/512)
-
Summarization (1024/256)
-
Code Generation (512/512)
Using these profiles, we can map specific I/O token scenarios to real-world use cases to make these runs more explainable in terms of how this impacts applications.
--rate-type
--rate-type defines the type of benchmark to run. By default GuideLLM will do a sweep of available benchmarks, but you may choose to isolate specific benchmark tests.
-
synchronous: Runs a single stream of requests one at a time. --rate must not be set for this mode.
-
throughput: Runs all requests in parallel to measure the maximum throughput for the server (bounded by GUIDELLM__MAX_CONCURRENCY config argument). --rate must not be set for this mode.
-
concurrent: Runs a fixed number of streams of requests in parallel. --rate must be set to the desired concurrency level/number of streams.
-
constant: Sends requests asynchronously at a constant rate set by --rate.
-
poisson: Sends requests at a rate following a Poisson distribution with the mean set by --rate.
-
sweep: Automatically determines the minimum and maximum rates the server can support by running synchronous and throughput benchmarks, and then runs a series of benchmarks equally spaced between the two rates. The number of benchmarks is set by --rate (default is 10).
Use-Case Specific Data Requirements
Training vs Production Data
This training uses emulated data for consistency:
{"type":"emulated","prompt_tokens":512,"output_tokens":128}For client engagements, use representative data for accurate performance evaluation.
Why Client Data Matters
Real workloads differ significantly from stock data:
-
Token distribution: Customer support (50-200 tokens typical) vs RAG (4K+ tokens)
-
Response variability: Fixed 128 tokens vs 50-800 token range in production
-
Processing patterns: Math reasoning vs creative writing stress different components
Performance Impact: Real data typically shows 25-40% higher latency variance and 2-5x difference in P99 metrics.
Production Evaluation Approach
-
Baseline: Use stock data for initial estimates
-
Validation: Test with client sample data
To ensure that evaluation results reflect real-world workloads, it’s important to request a representative client dataset. This helps validate baseline assumptions and capture unique workload characteristics such as traffic distribution, query complexity and domain-specific edge cases.
-
Format: Provide data in JSONL or CSV format or any of the supported formats.
-
Sample Size: At least 1,000 representative records are recommended, though larger samples improve accuracy.
-
Scope: Include both common queries (80% of volume) and atypical/edge cases (20%).
-
Security: Client should remove or anonymize any sensitive information before sharing.
-
-
Production: Use historical logs for final sizing
Technical Consulting Guidelines
During Discovery:
-
Request sample queries (80% typical usage)
-
Identify peak patterns and edge cases
During PoC:
-
Start with stock data for baseline
-
Compare with client data to quantify differences
-
Plan 20-30% performance buffer
Stock Data Limitations:
-
Tests well: Infrastructure capacity, relative comparisons, scaling
-
Misses: Real workload complexity, traffic variations, domain-specific patterns
Key Takeaway: Stock data for learning; client data for production recommendations.
Execute the pipeline
Set your external model inference endpoint
export INFERENCE_ENDPOINT=$(oc get inferenceservice granite-8b -n vllm -o jsonpath='{.status.url}')
Make sure your granite-8b model is deployed on OpenShift AI. If you need to deploy it run:helm upgrade -i granite-8b redhat-ai-services/vllm-kserve --version 0.5.11 --values workshop_code/deploy_vllm/vllm_rhoai_custom_1/values.yaml -n vllm
|
Run the pipeline with necessary parameters in a terminal. Accept the defaults when prompted. If you chose a different model, adjust the target parameter.
tkn pipeline start guidellm-benchmark-pipeline -n vllm \
  --param target=$INFERENCE_ENDPOINT/v1 \
  --param model-name="granite-8b" \
  --param processor="ibm-granite/granite-3.3-8b-instruct" \
  --param data-config="prompt_tokens=512,output_tokens=128" \
  --param max-seconds="30" \
  --param huggingface-token="" \
  --param api-key="" \
  --param rate="2" \
  --param rate-type="sweep" \
  --param max-concurrency="10" \
  --workspace name=shared-workspace,claimName=guidellm-output-pvc
HINT: If the pipeline run fails with HTTPStatusError: Server error '503 Service Unavailable' for the provided INFERENCE_ENDPOINT, then check and fix the relevant network policy.
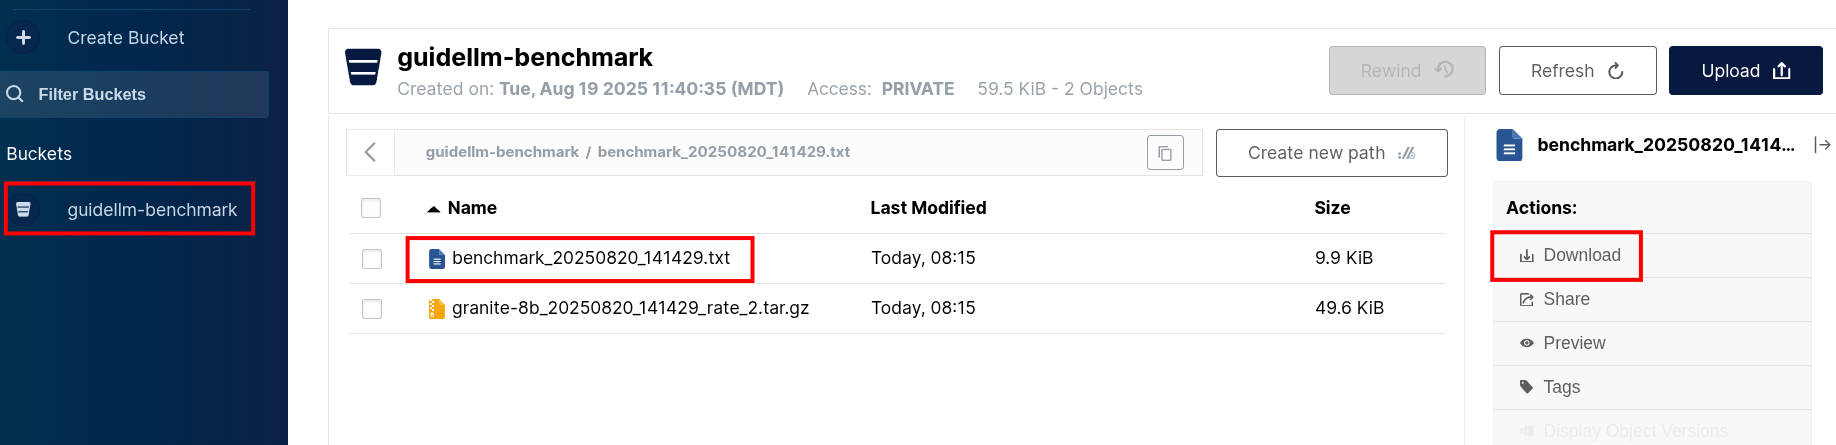
Download the benchmark results from the guidellm-benchmark bucket in Minio and open the benchmark-<TIMESTAMP>.txt in a text editor.
Get the route to the Minio UI. The login is minio/minio123
oc get route console -n ic-shared-minio -o jsonpath='{.spec.host}'Minio bucket
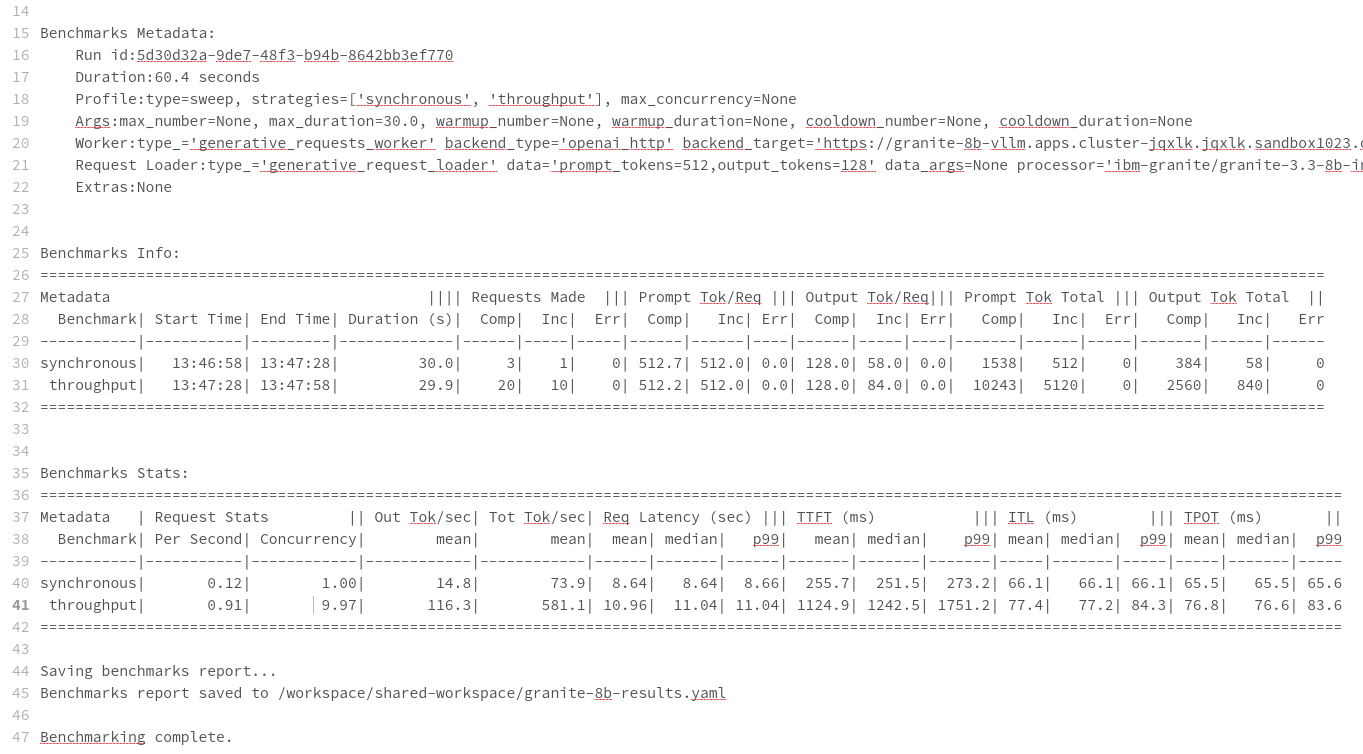
Benchmark results
Evaluate Output and Adjust GuideLLM Settings
GuideLLM captures the following metrics during a full sweep:
-
Requests per Second: Total requests completed per second
-
Request concurrency: average concurrent requests
-
Output token per second (mean): output tokens per second
-
Total tokens per second (mean): total (prompt + output) tokens per second
-
Request latency in ms (mean, median, p99): total end to end request latency
-
Time to First Token (mean, median, p99)
-
Inter-Token Latency (mean, median, p99)
-
Time per output token (mean, median, p99)
See the complete metrics documentation.
Reading Output
Top Section (Benchmark Info)
-
Benchmark: The type of benchmark ran
-
constant@x indicates the number of requests sent constantly to the model per second.
-
-
Requests Made: How many requests issued (completed, incomplete or errors)
-
Token Data
-
Tok/Req: average tokens per request
-
Tok Total: total number of input/output tokens processed
-
Advanced Performance Evaluation Exercises
For advanced engagements, it’s crucial to demonstrate how different workload characteristics impact performance. The following exercises provide specific scenarios that align with common client use cases.
Exercise 1: Token Size Impact Analysis
Understanding how input/output token ratios affect performance is essential for capacity planning and cost estimation.
Exercise 1a: Chat Application Simulation
Test a typical conversational AI scenario with short prompts and responses:
tkn pipeline start guidellm-benchmark-pipeline -n vllm \
  --param target=$INFERENCE_ENDPOINT/v1 \
  --param model-name="granite-8b" \
  --param processor="ibm-granite/granite-3.3-8b-instruct" \
  --param data-config="prompt_tokens=256,output_tokens=128" \
  --param max-seconds="30" \
  --param huggingface-token="" \
  --param api-key="" \
  --param rate="2" \
  --param rate-type="sweep" \
  --param max-concurrency="10" \
  --workspace name=shared-workspace,claimName=guidellm-output-pvc
Business Context: Represents customer service chatbots, virtual assistants, or interactive coding assistants where users expect rapid, conversational responses.
Exercise 1b: RAG (Retrieval-Augmented Generation) Simulation
Test document-heavy workloads with large context windows:
tkn pipeline start guidellm-benchmark-pipeline -n vllm \
  --param target=$INFERENCE_ENDPOINT/v1 \
  --param model-name="granite-8b" \
  --param processor="ibm-granite/granite-3.3-8b-instruct" \
  --param data-config="prompt_tokens=4096,output_tokens=512" \
  --param max-seconds="30" \
  --param huggingface-token="" \
  --param api-key="" \
  --param rate="2" \
  --param rate-type="sweep" \
  --param max-concurrency="10" \
  --workspace name=shared-workspace,claimName=guidellm-output-pvc
Business Context: Enterprise knowledge base queries, document analysis, or research assistance where large amounts of context are processed.
Exercise 1c: Code Generation Workload
Test balanced input/output for development use cases:
tkn pipeline start guidellm-benchmark-pipeline -n vllm \
  --param target=$INFERENCE_ENDPOINT/v1 \
  --param model-name="granite-8b" \
  --param processor="ibm-granite/granite-3.3-8b-instruct" \
  --param data-config="prompt_tokens=512,output_tokens=512" \
  --param max-seconds="30" \
  --param huggingface-token="" \
  --param api-key="" \
  --param rate="2" \
  --param rate-type="sweep" \
  --param max-concurrency="10" \
  --workspace name=shared-workspace,claimName=guidellm-output-pvc
Business Context: AI-powered development tools, code completion, and automated programming assistance.
Exercise 2: Rate Type Deep Dive
Different rate types reveal distinct performance characteristics critical for technical consulting. Select one option to test during this exercise due to time restrictions.
Exercise 2a: Peak Capacity Assessment (Throughput)
Determine maximum theoretical performance:
tkn pipeline start guidellm-benchmark-pipeline -n vllm \
  --param target=$INFERENCE_ENDPOINT/v1 \
  --param model-name="granite-8b" \
  --param processor="ibm-granite/granite-3.3-8b-instruct" \
  --param data-config="prompt_tokens=512,output_tokens=256" \
  --param max-seconds="30" \
  --param huggingface-token="" \
  --param api-key="" \
  --param rate="2" \
  --param rate-type="throughput" \
  --param max-concurrency="10" \
  --workspace name=shared-workspace,claimName=guidellm-output-pvc
Technical Consulting Value:
-
Establishes theoretical maximum capacity for infrastructure sizing
-
Identifies hardware bottlenecks and scaling limits
-
Provides baseline for capacity planning and cost modeling
Exercise 2b: Real-World Load Simulation (Constant)
Test sustained production loads:
tkn pipeline start guidellm-benchmark-pipeline -n vllm \
  --param target=$INFERENCE_ENDPOINT/v1 \
  --param model-name="granite-8b" \
  --param processor="ibm-granite/granite-3.3-8b-instruct" \
  --param data-config="prompt_tokens=512,output_tokens=256" \
  --param max-seconds="30" \
  --param huggingface-token="" \
  --param api-key="" \
  --param rate="2" \
  --param rate-type="constant" \
  --param max-concurrency="10" \
  --workspace name=shared-workspace,claimName=guidellm-output-pvc
Technical Consulting Value:
-
Validates performance under realistic sustained loads
-
Identifies latency degradation patterns as load increases
-
Supports SLA definition and performance guarantees
Exercise 2c: Burst Traffic Analysis (Poisson)
Test irregular, bursty workloads typical in enterprise environments:
tkn pipeline start guidellm-benchmark-pipeline -n vllm \
  --param target=$INFERENCE_ENDPOINT/v1 \
  --param model-name="granite-8b" \
  --param processor="ibm-granite/granite-3.3-8b-instruct" \
  --param data-config="prompt_tokens=512,output_tokens=256" \
  --param max-seconds="30" \
  --param huggingface-token="" \
  --param api-key="" \
  --param rate="2" \
  --param rate-type="poisson" \
  --param max-concurrency="10" \
  --workspace name=shared-workspace,claimName=guidellm-output-pvc
Technical Consulting Value:
-
Models real-world traffic patterns with natural variability
-
Reveals queue management and batching effectiveness
-
Supports autoscaling configuration and resource allocation
Exercise 3: Comparative Analysis Framework
Run multiple configurations to build performance profiles for client decision-making:
Token Scaling Analysis
Execute all three token configurations sequentially and compare:
-
Baseline (Chat): 256/128 tokens
-
Medium (Mixed): 1024/256 tokens
-
Heavy (RAG): 4096/512 tokens
Analysis Points for Technical Consulting:
-
Memory Usage Scaling: How does KV cache grow with context length?
-
Latency Patterns: Linear vs exponential increases with token count
-
Throughput Impact: Requests/second degradation with larger contexts
-
Cost Implications: GPU hours required for different workload types
Rate Type Performance Matrix
Test each rate type with consistent token configuration to isolate performance characteristics:
-
Synchronous: Baseline single-request latency
-
Constant: Sustained load performance
-
Poisson: Variable load handling
-
Sweep: Comprehensive performance curve
Technical Consulting Applications:
-
Infrastructure Sizing: Use throughput results for hardware recommendations
-
SLA Development: Leverage latency percentiles for performance guarantees
-
Cost Modeling: Apply sustained load results to pricing calculations
-
Scaling Strategy: Use sweep results to plan horizontal scaling triggers
Enhanced Metrics Interpretation
Critical Performance Indicators
Time to First Token (TTFT)
Business Impact: Direct correlation to user experience and perceived responsiveness
-
Target: <200ms for interactive applications
-
Acceptable: 200-500ms for productivity tools
-
Problematic: >500ms indicates infrastructure or model optimization issues
Technical Consulting Guidance:
-
High TTFT often indicates memory bandwidth limitations
-
Consistent across rate types suggests model-level bottlenecks
-
Variable TTFT indicates queueing or resource contention
Inter-Token Latency (ITL)
Business Impact: Affects streaming response quality and user engagement
-
Target: <50ms for smooth streaming experience
-
Monitoring: P99 values reveal worst-case user experience
-
Optimization: Focus on batching efficiency and memory management
Request Latency Distribution Analysis
For Technical Consulting:
-
Mean: General performance overview, useful for capacity planning
-
Median: Typical user experience, critical for SLA commitments
-
P99: Tail latency, essential for user satisfaction and system reliability
Red Flags:
-
Large gap between median and P99 indicates inconsistent performance
-
Degrading P99 under load suggests approaching capacity limits
-
High variability points to resource contention or inefficient scheduling
Business Alignment Framework
Cost-Performance Analysis
Map performance metrics to business value:
Throughput-Based Costing:
Cost per Request = (GPU Hours x Hourly Rate) / Total Requests ProcessedQuality-of-Service Tiers:
-
Premium: P99 < 500ms, High throughput, Premium pricing
-
Standard: P99 < 1000ms, Medium throughput, Standard pricing
-
Economy: P99 < 2000ms, Lower throughput, Budget pricing
Capacity Planning Recommendations
Based on Sweep Results:
-
Peak Efficiency Point: Identify request rate with optimal cost/performance ratio
-
Linear Scaling Range: Determine where performance degrades linearly vs exponentially
-
Breaking Point: Establish maximum sustainable load before quality degradation
Infrastructure Sizing Formula:
Required GPUs = (Peak Expected RPS x Safety Margin) / Sustainable RPS per GPUTroubleshooting Performance Issues
High Latency Diagnosis
-
TTFT > ITL: Memory bandwidth or model loading bottleneck
-
ITL >> TTFT: Compute or batching inefficiency
-
Both High: Infrastructure under-sizing or configuration issues
Low Throughput Diagnosis
-
Compare synchronous vs throughput: Reveals batching effectiveness
-
Monitor GPU utilization: Low utilization indicates non-GPU bottlenecks
-
Analyze queue depths: High queuing suggests insufficient parallelism
Inconsistent Performance Diagnosis
-
P99 >> Median: Resource contention or thermal throttling
-
Variable between runs: External factors or inadequate warm-up
-
Degradation over time: Memory leaks or resource exhaustion
This comprehensive evaluation framework enables technical consultants to provide data-driven recommendations for LLM deployment optimization, infrastructure sizing, and cost management.
Summary
This activity demonstrated how to evaluate system performance using GuideLLM with a default vLLM configuration. By configuring vLLM more precisely or your chosen inference runtime, you can better align model serving with application needs—whether you’re optimizing for cost, speed, or user experience.